The state of
Community Conservation
in Namibia
A summary of the annual report
2017
The full report may be downloaded at www.nacso.org.na and is available at the NACSO office in Windhoek.
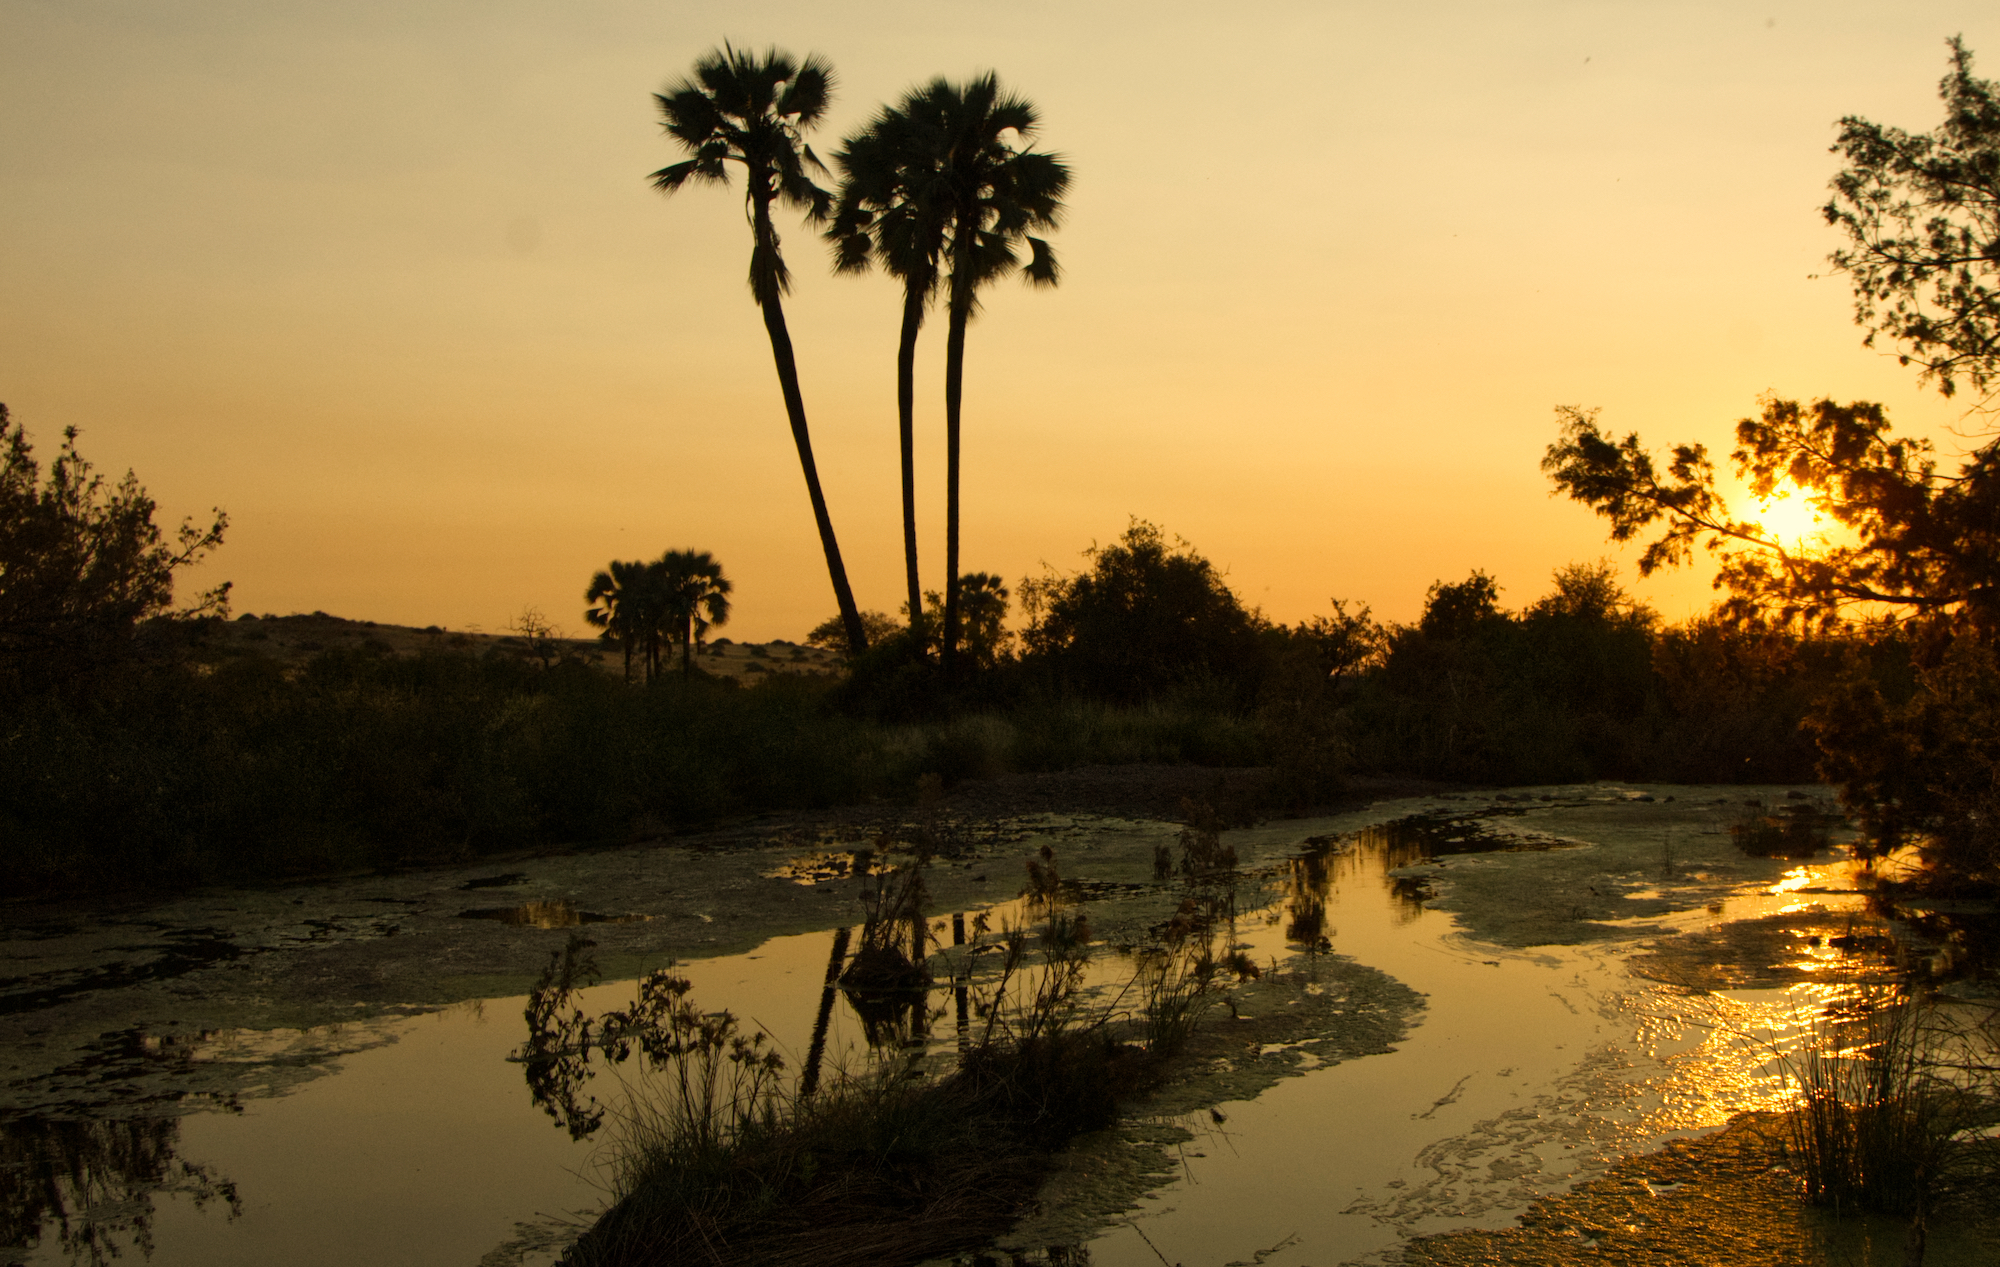
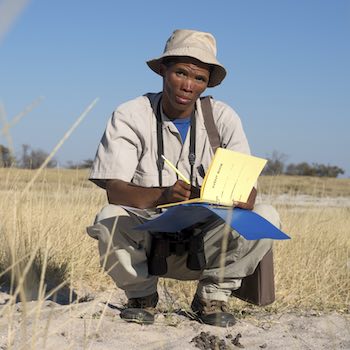
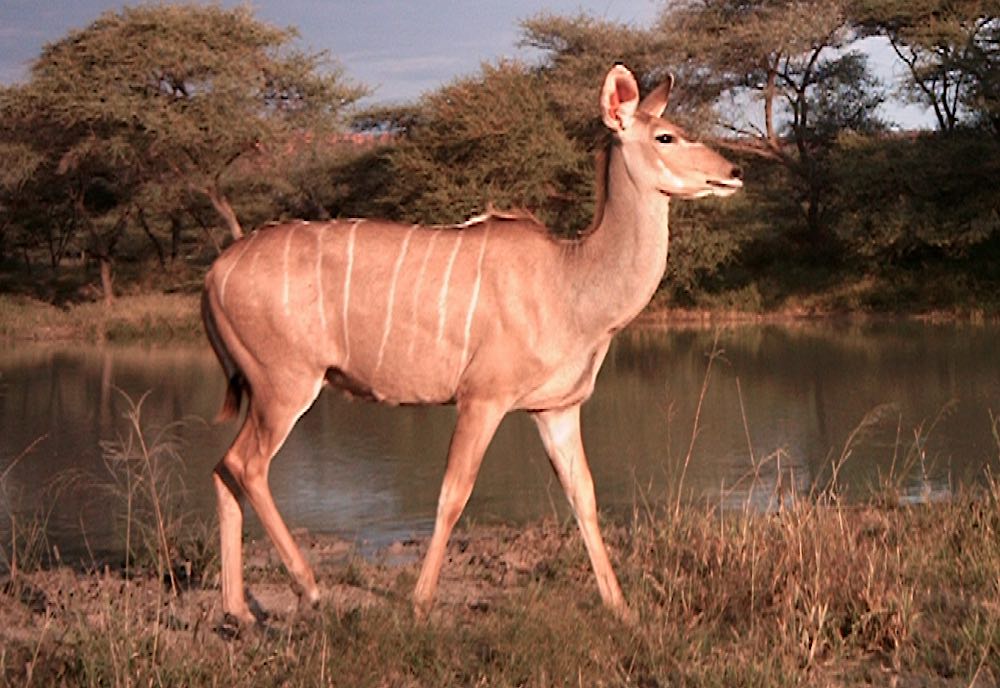
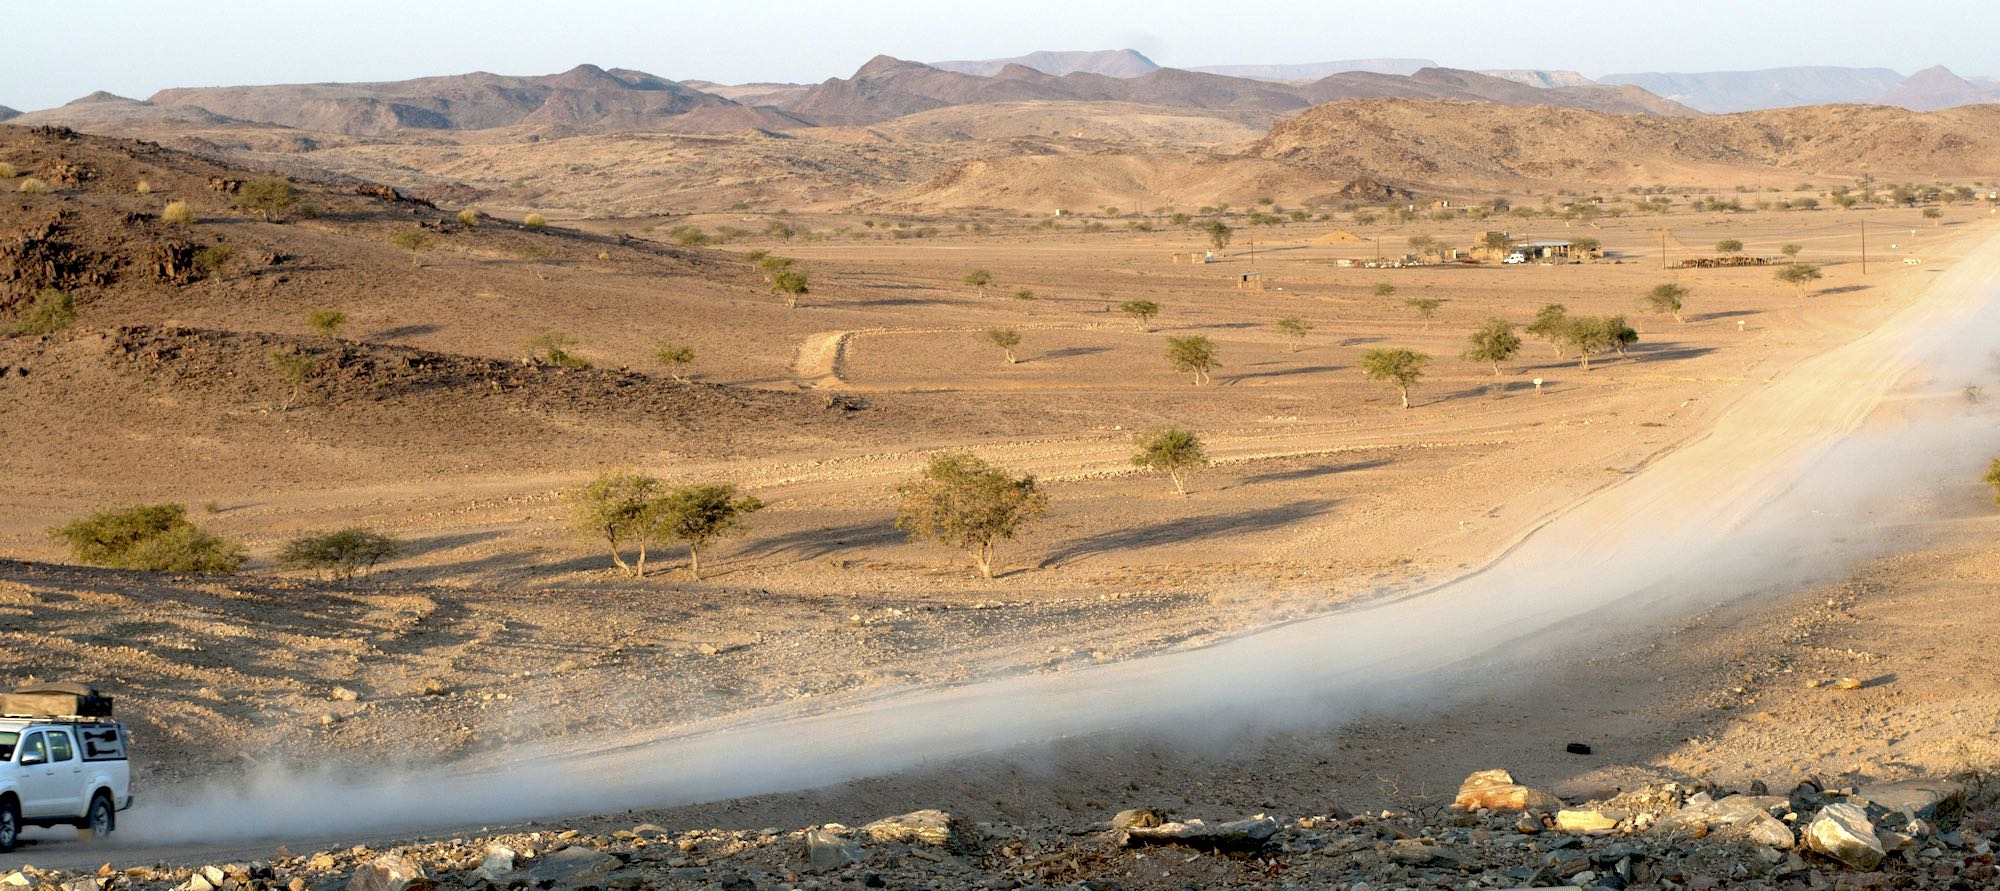
Living with wildlife
Community Conservation in Namibia
... means striving for balanced land use and a healthy environment. Wildlife — and all natural resources — can be utilised sustainably and integrated with other rural livelihood activities for the benefit of the people and the land...
Community conservation is about managing natural resources sustainably to generate returns for rural people. Conservancies, community forests and other community conservation initiatives create the necessary legal framework for this. By choosing to live with wildlife, rural communities are broadening their livelihood options as well as enabling a healthier environment. Through wise and sustainable management and use, natural resources are conserved for future generations while providing significant returns today.
What’s being achieved?
At the end of 2017 there were...
- 83 registered communal conservancies.
- 1 community conservation association in a national park (Kyaramacan Association – managed like a conservancy).
- 19 concessions in national parks or on other state land held by 23 conservancies (some conservancies share concessions).
- 32 registered community forests.
- 2 community fish reserves.
Community conservation...
- Covers 166,267 km2, which is about 53.2% of all communal land with an estimated 212,092 residents (another approximately 6,170 members of the Kyaramacan Association live in Bwabwata National Park)
- of this area, conservancies manage 163,151 km2, which is 19.8% of Namibia
- community forests cover 30,828 km2, 89.9% of which overlaps with conservancies
- from the beginning of 1990 to the end of 2017, community conservation contributed an estimated N$ 7.11 billion to Namibia’s net national income
- during 2017, community conservation generated over N$ 132 million in returns for local communities
- community conservation facilitated 5,350 jobs in 2017
CBNRM
Community Based Natural Resource Management
The earliest community-based conservation initiatives in Namibia, which have today developed into a national CBNRM programme, started before independence when the first community game guards were appointed by local headmen in an attempt to reverse wildlife declines. At the time, wild animals were seen as little more than a threat to crops, livestock and infrastructure, and to community safety. Furthermore, people living in communal areas had been denied their traditional rights to utilize wildlife.
Ground-breaking legislation passed in the mid-nineties laid the foundation for a new approach to natural resource use. By forming legally-recognized community conservation organizations such as conservancies and community forests, people in communal areas can now actively manage natural resources and generate returns from them. This continues to encourage wildlife recoveries and environmental restoration.
The first conservancies were registered in 1998 and the first community forests in 2006. The Kyaramacan Association was founded in 2006 within Bwabwata National Park and is treated as a conservancy by NACSO. While community conservation organizations are resource management units and businesses, they are also defined by social ties uniting groups of people with the common goal of conservation.
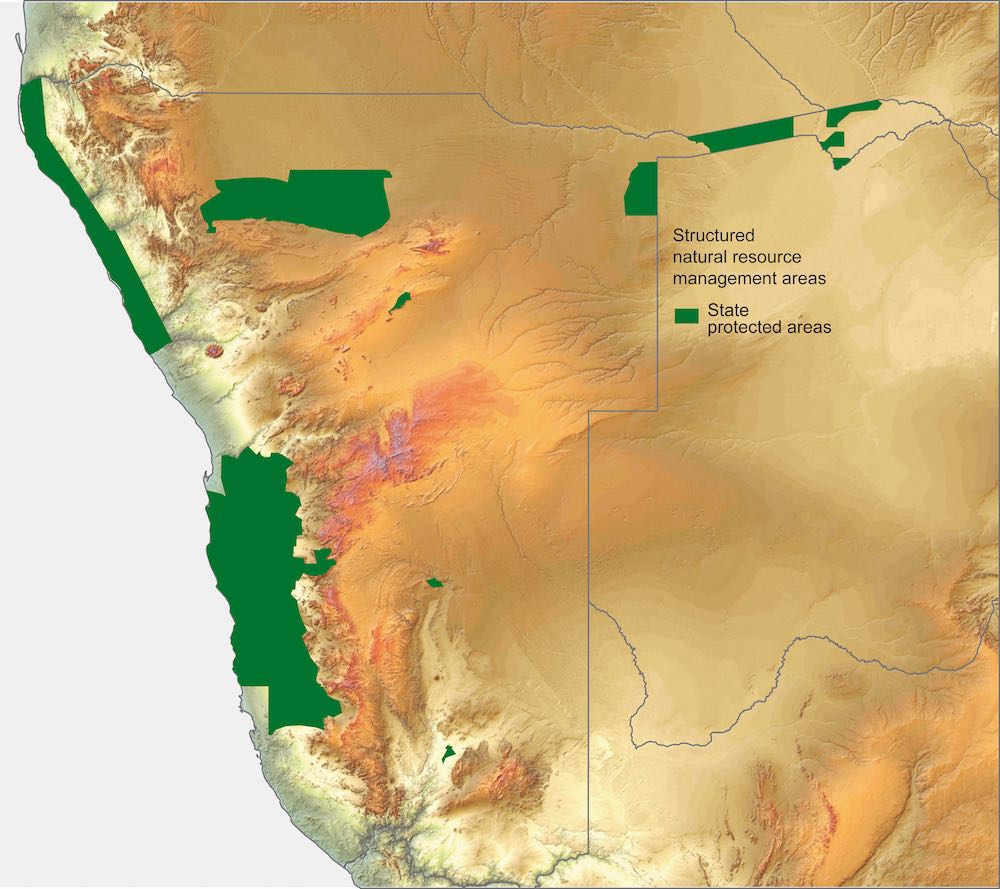
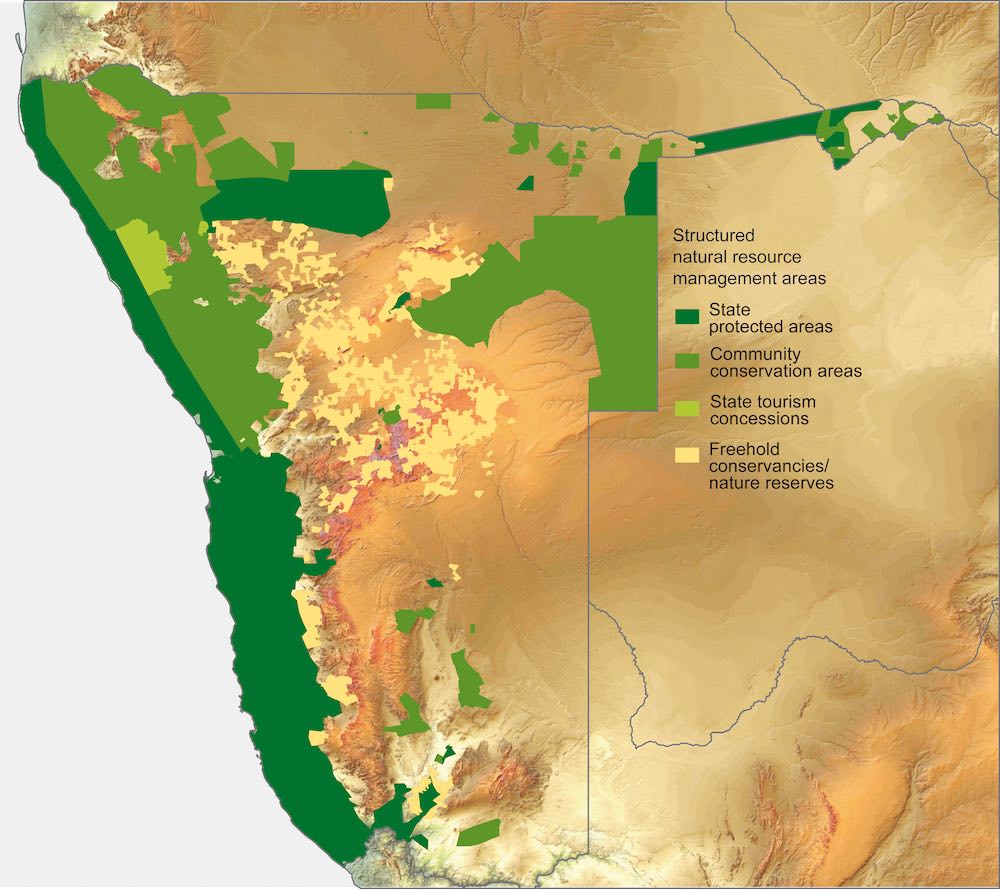
The expansion of structured natural resource management across Namibia
At independence in 1990, there were no registered community conservation areas, freehold conservancies did not exist, and a mere 14% of land was under recognized conservation management. At the end of 2017, land under structured natural resource management covered 43.87% of Namibia.
The distribution of conservancies and community forests across Namibia
At the end of 2017, there were 83 registered communal conservancies and 32 registered community forests in Namibia and one community association in a national park, covering 166,267 km2. [The lists below follow the chronological sequence of registration]
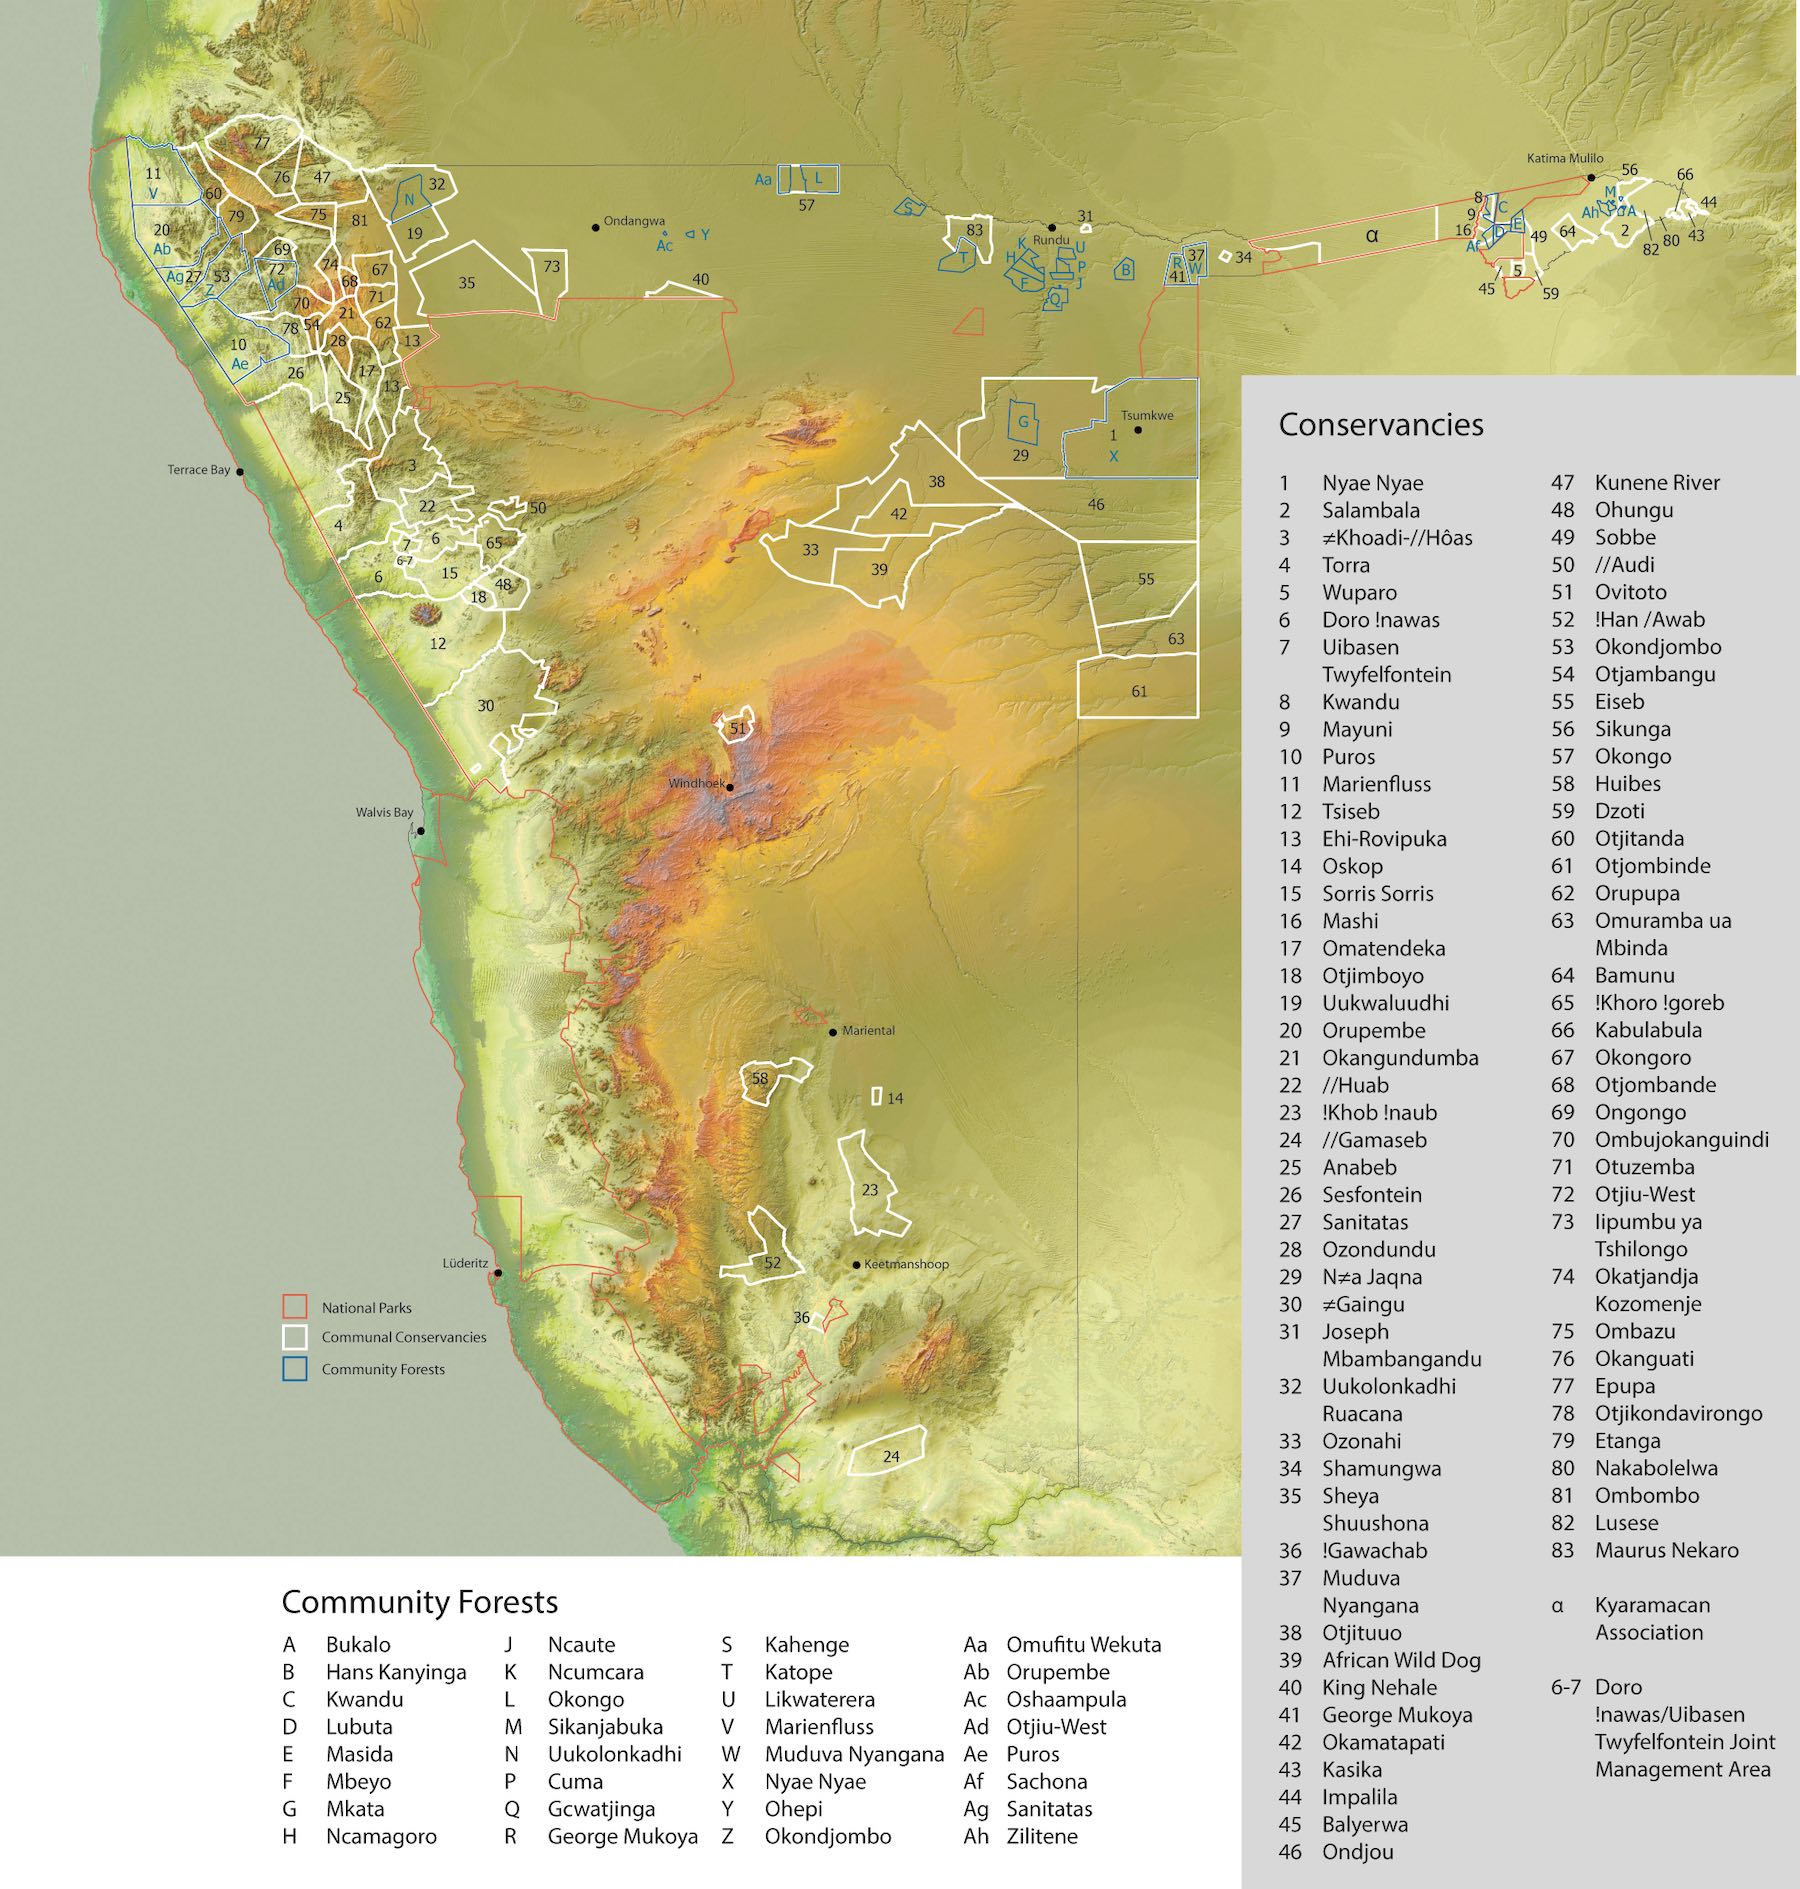
The Ministry of Environment and Tourism facilitates the registration of conservancies and is responsible for compliance monitoring. NACSO supports the MET in conservancy governance and assists in the annual game counts.
NACSO Members


Associate Members
Three Regional Conservancy Associations - Kavango, Kunene and Otjozondjupa.
These are independent organisations comprised of registered and emerging
conservancies in their respective regions acting as representative umbrella bodies.
Three pillars of community conservation in Namibia
Natural resource management
Innovative resource management enables biodiversity conservation and the sustainable use of wildlife and plant resources.
Institutional development
Good governance creates the basis for resource management and the equitable distribution of returns.

Business, enterprises and livelihoods
Incentive-based conservation approaches enable an expanding range of rural livelihood options.
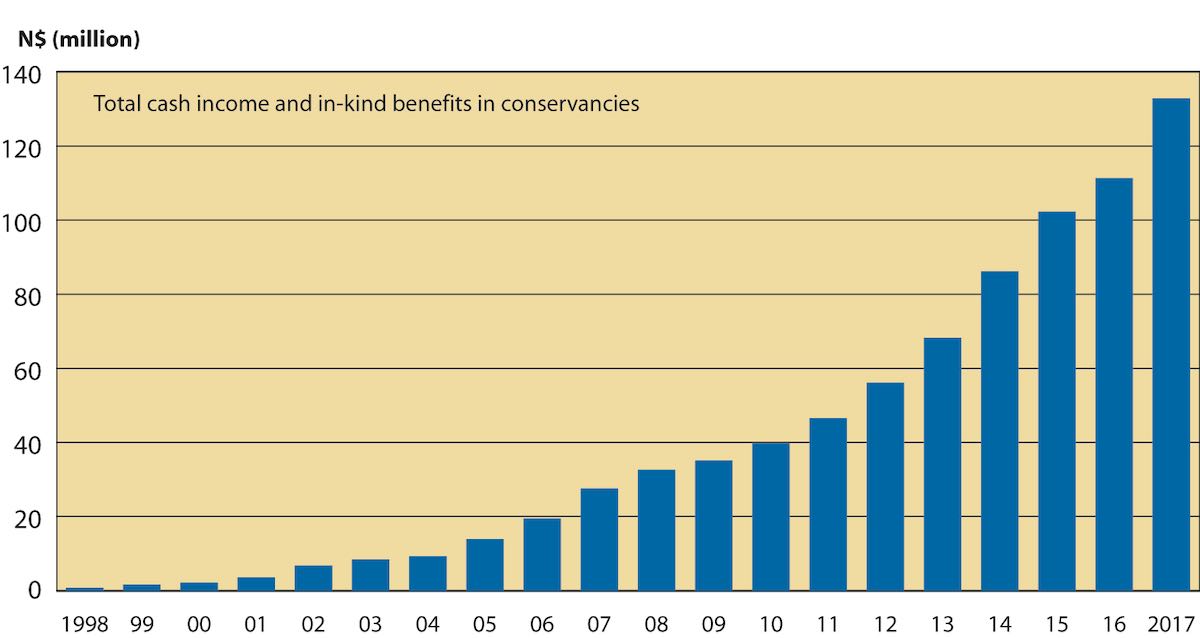
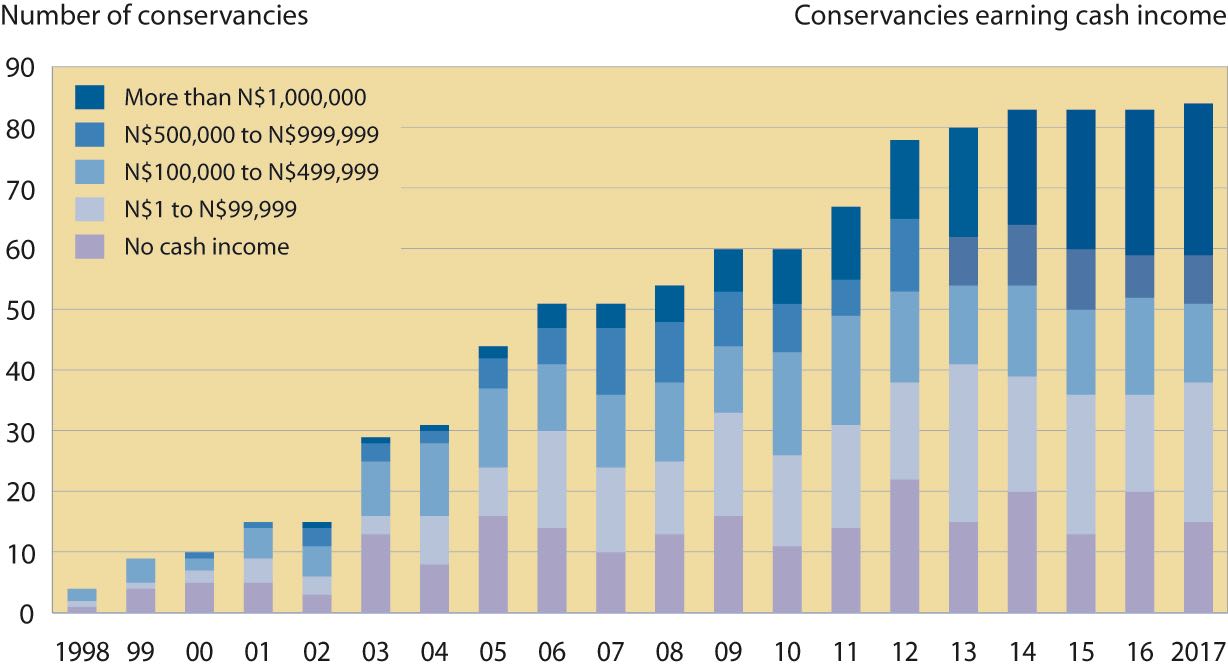
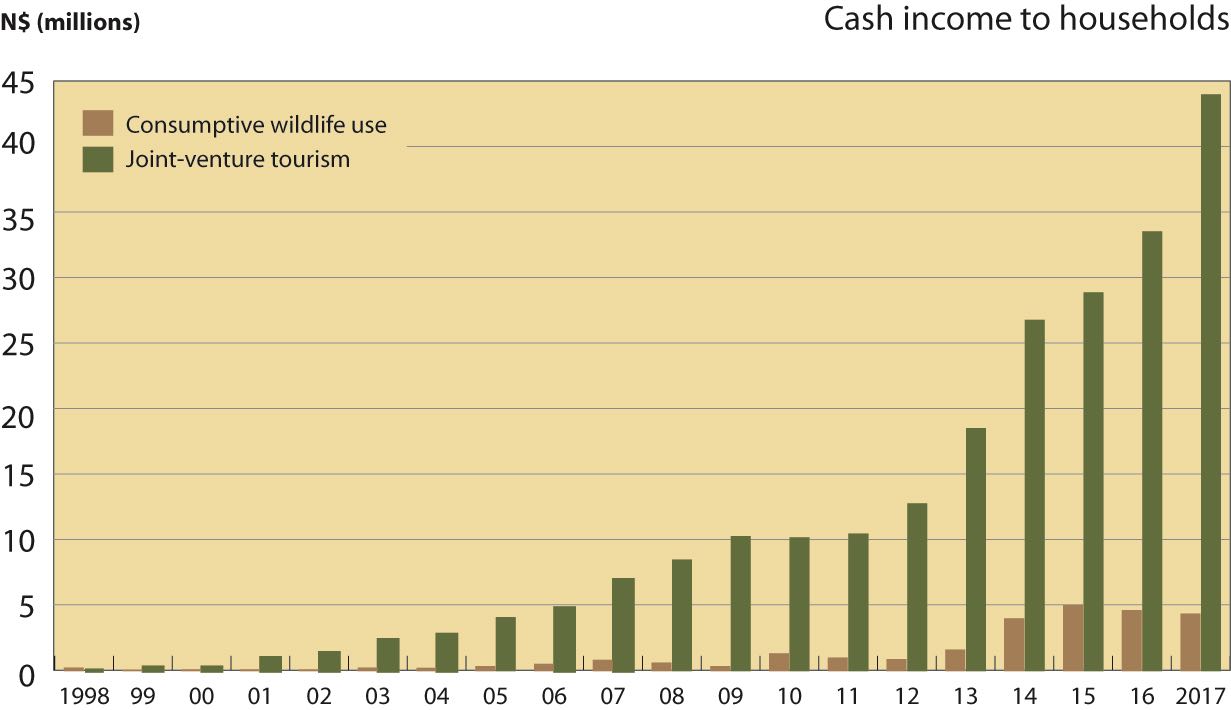
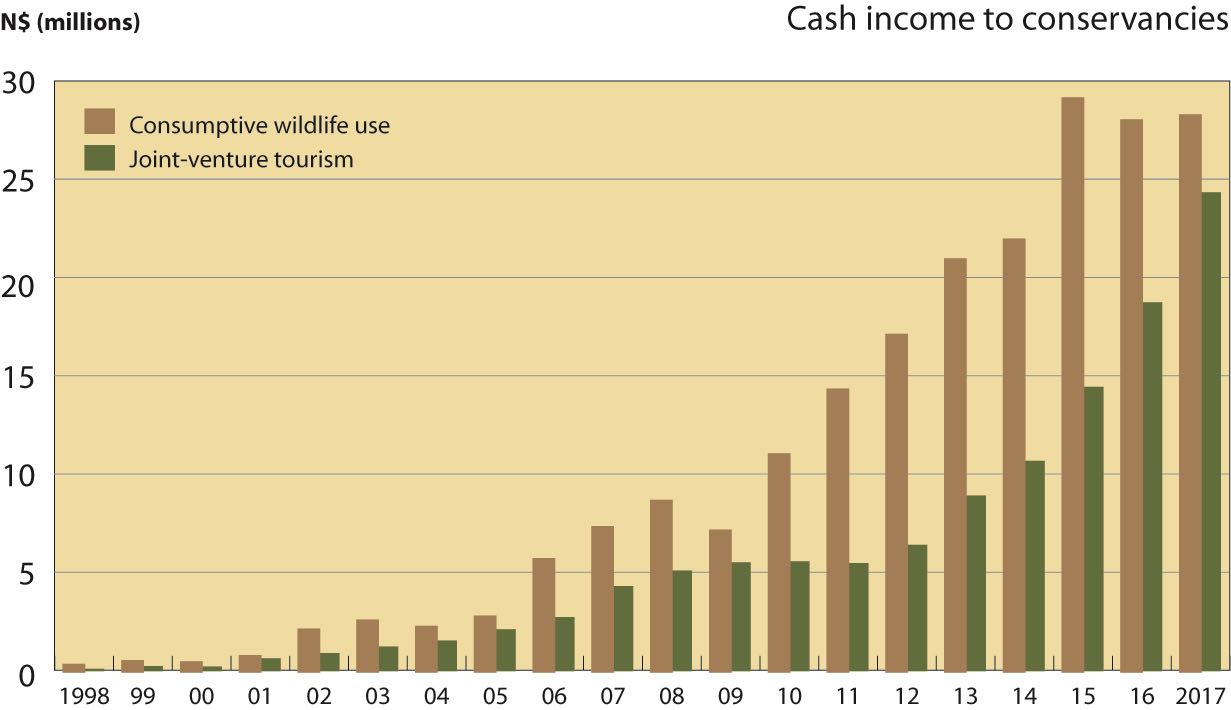
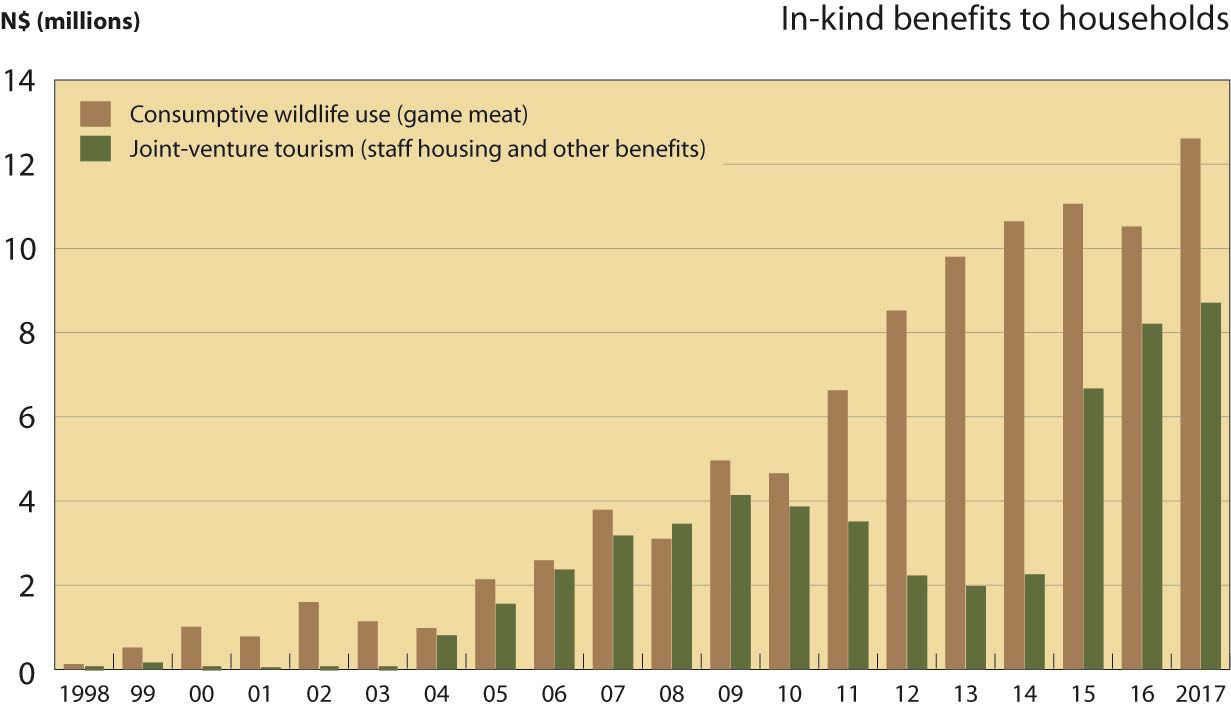
Total returns to conservancies and members
The total cash income and in-kind benefits generated in conservancies (including the Kyaramacan Association) grew from less than N$ 1 million in 1998 to more than N$132 million in 2017. This includes all directly measurable income and in-kind benefits being generated, and can be divided into cash income to conservancies (mostly through partnerships with private sector operators), cash income to residents from enterprises (mostly through employment and the sale of products), and as in-kind benefits to residents (mostly the distribution of harvested game meat).
The benefits of community conservation
Community conservation
has shown that it can improve rural lives while contributing to biodiversity conservation, and is recognized as a national development strategy. Many conservancies are showing that conservation can generate a broad range of community and individual returns (see graph) while covering their operational costs from their own income.
Community conservation can become fully sustainable and largely self-financing in the foreseeable future, provided that appropriate resources continue to be invested to entrench governance foundations, optimize returns, and mitigate threats and barriers to development.
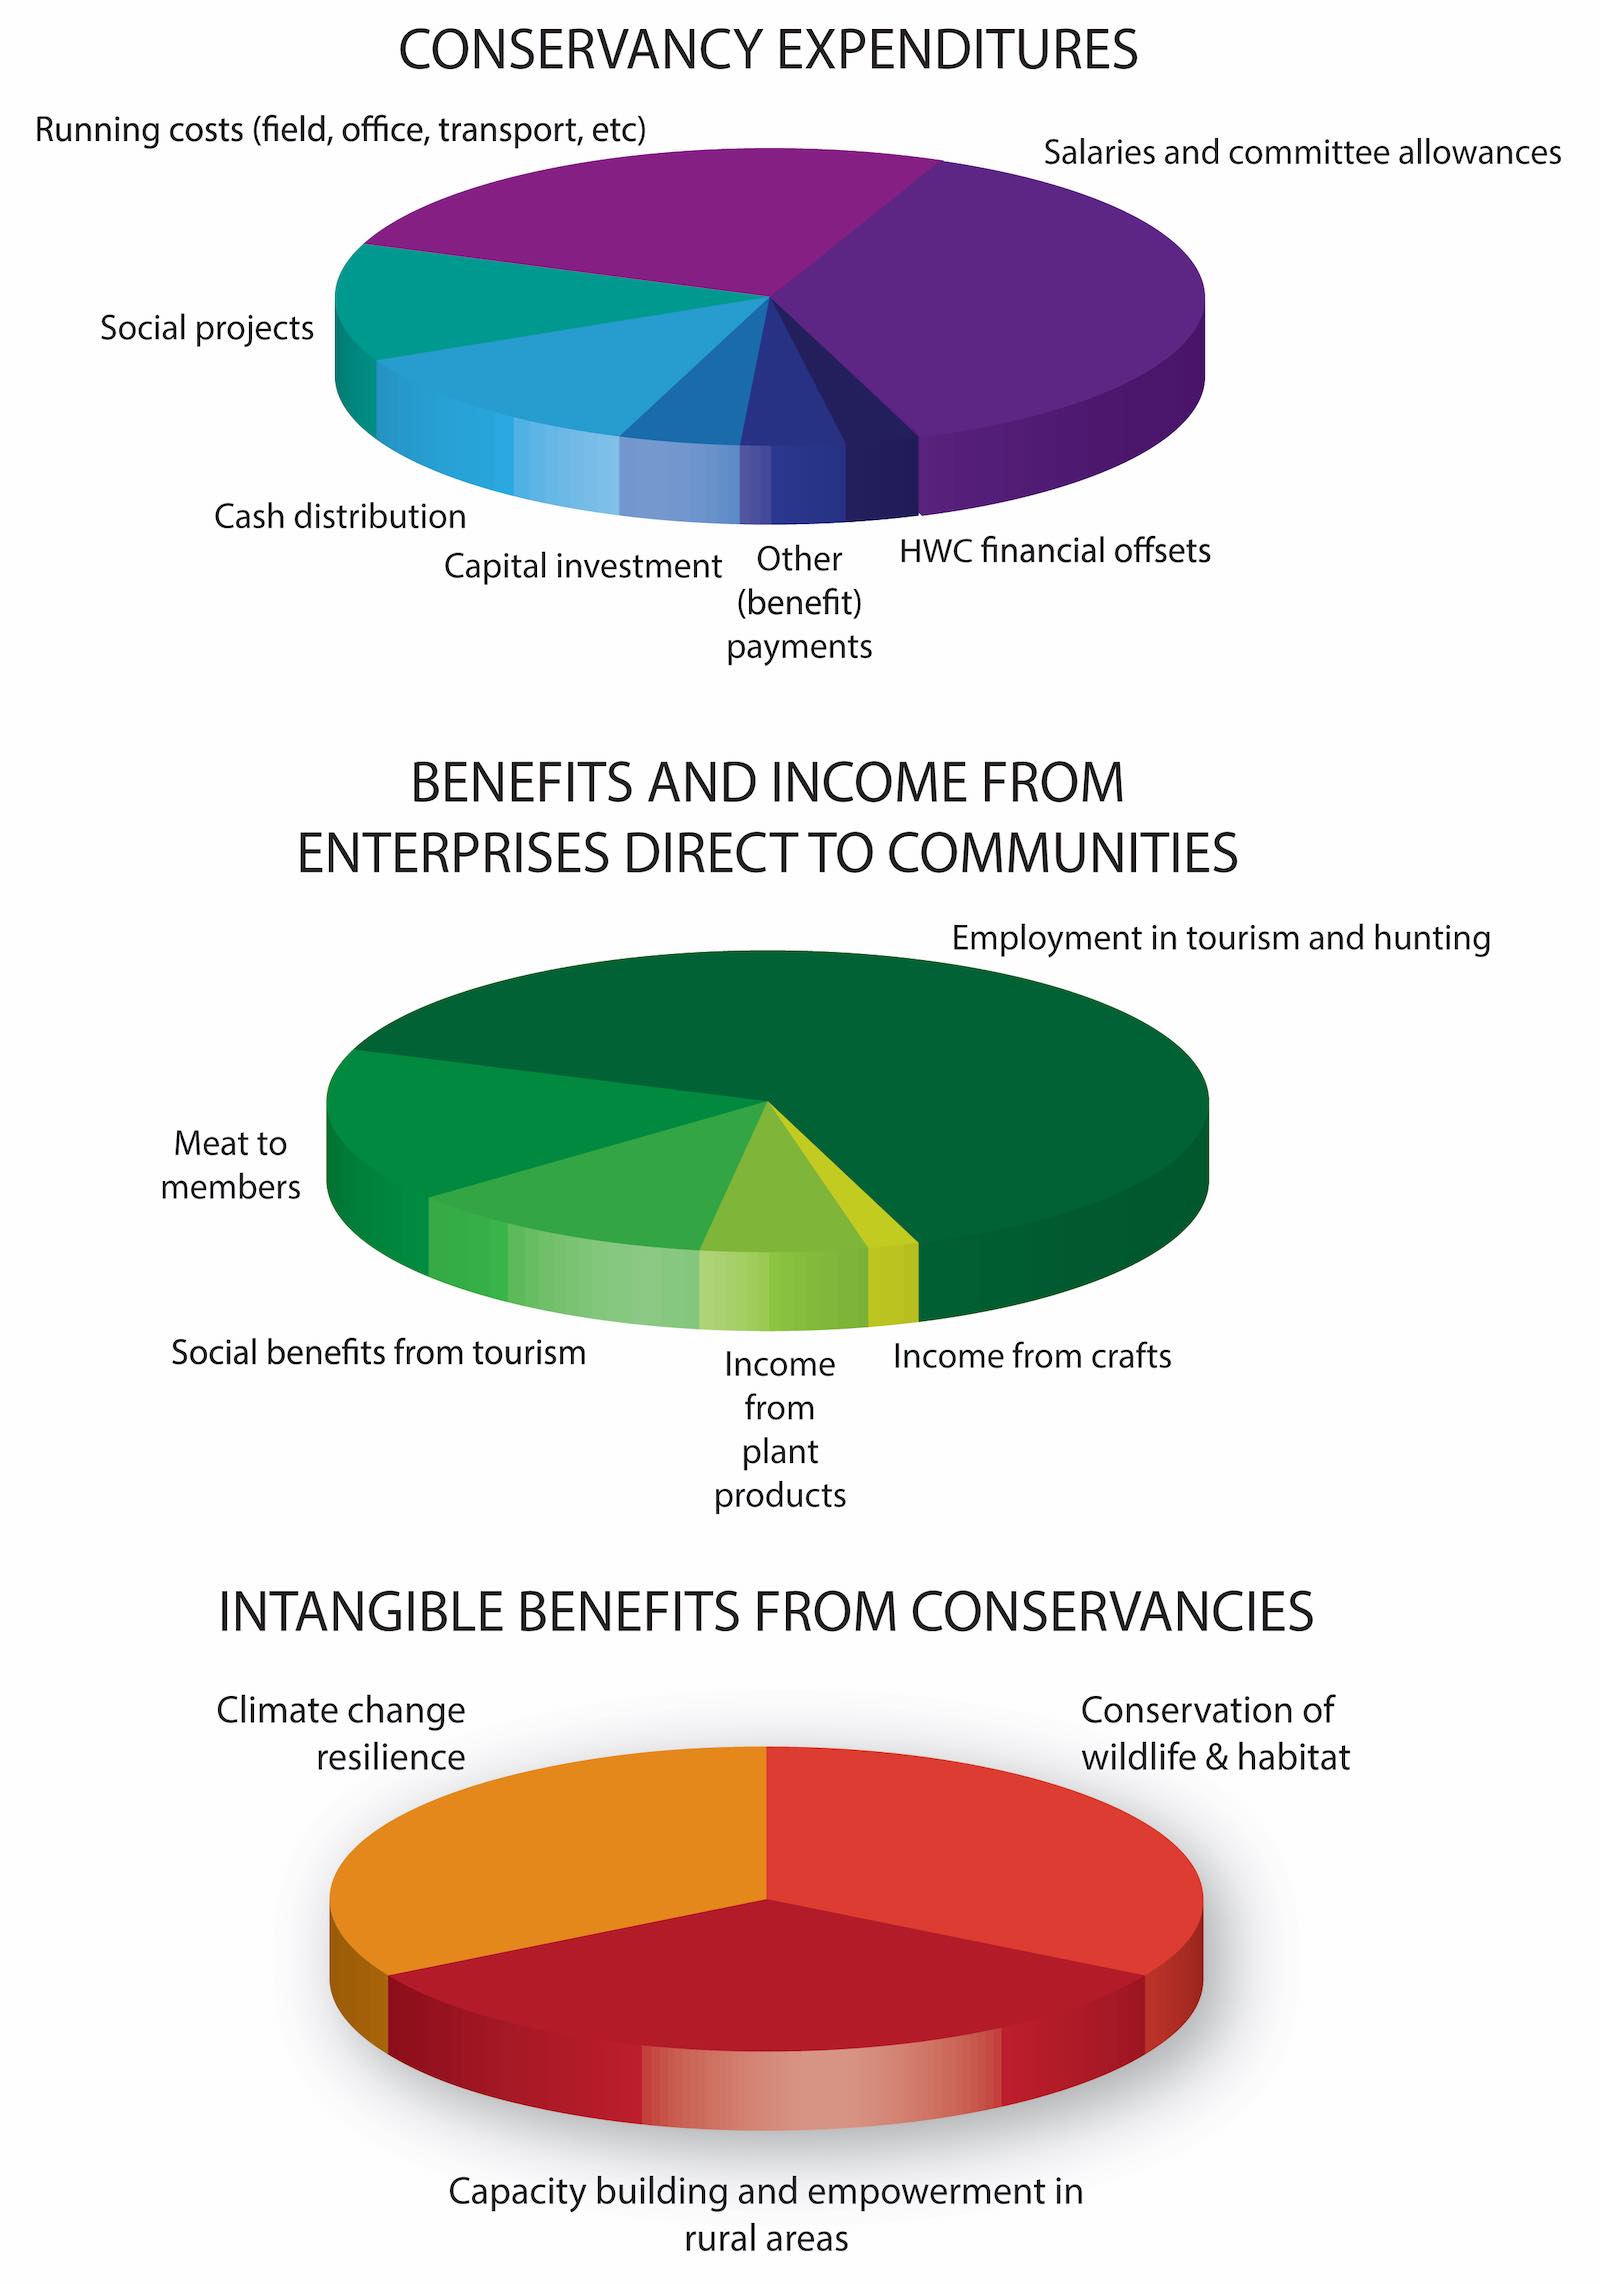
Conservancy expenditure and benefits
Income to conservancies is spent on salaries, office and other operating costs, and benefits to members (top circle).
Conservancies generate additional income, which goes directly to residents, especially from employment in tourism and hunting, and from harvesting plant products and selling crafts (green circle).
Intangible benefits encompass the empowerment of rural communities, including women, resilience to climate change through the diversification of income, and fostering a collective community voice on development issues.
The top two circles represent financial information for 2017. The lower circle is not quantified
Managing Resources
... means ensuring that they are used wisely so that maximum returns are generated while the natural environment remains productive and healthy ...
Wildlife numbers
Namibia’s game counts are scientifically based, and are designed to include conservancy members, NGO workers and MET rangers in a joint effort that generates both data and strengthens partnerships. The counts provide an indication of where game occurs, an approximate estimate of how many animals there are, but most importantly, they track changes and trends in population numbers over time. The figures on the following pages, showing long-term trends, are used as a key indicator of success or failure in conservation.
In large open areas where animals are free to roam, determining trends is challenging because animals can move into or out of the areas being monitored. In addition, in certain regions, and in particular in desert conditions, animal numbers are driven to a large extent by good and poor rainfall seasons resulting in ‘boom and bust’ cycles in wildlife populations. These two factors make the analysis of trend data extremely challenging, particularly over the short-term, and therefore a long-term view must be taken.
It is evident that in the north-west conservancies, wildlife numbers have declined significantly in recent years. This is largely a result of the extended drought cycle leading to increased mortalities and reduced breeding rates. But this is not the only reason: serious destocking through harvesting was necessary in the early years of the drought cycle to reduce mass mortalities.
The return of patchy rainfall to the Erongo and Kunene regions in 2016 led to a short-term increase of species of plains game, particularly springbok, which have the ability to respond quickly to good rainfall. However, many game species will need several years of good rains, coupled with low take-off rates, to fully recover.
Human wildlife conflict
Recorded incidents of human-wildlife conflict have grown due to the increase in wildlife populations and shifting movement patterns of humans and wildlife in response to drought. However, the average number of incidents per conservancy remains generally stable. Crop protection from raiders, especially elephants, remains a major problem in the north-east.
A Human-wildlife Conflict Policy was established by the MET in 2009 to provide national guidelines for conflict mitigation. The policy sets out a framework for managing wildlife conflicts, where possible at local community level.
Two key strategies seek to mitigate the costs of living with wildlife. The first is prevention – practical steps for keeping wildlife away from crops and livestock. The second is the Human-Wildlife Self Reliance Scheme, which involves payments to those who have suffered losses. The MET has provided finance for this from the Game Products Trust Fund, and conservancies with sufficient income are encouraged to match this funding.
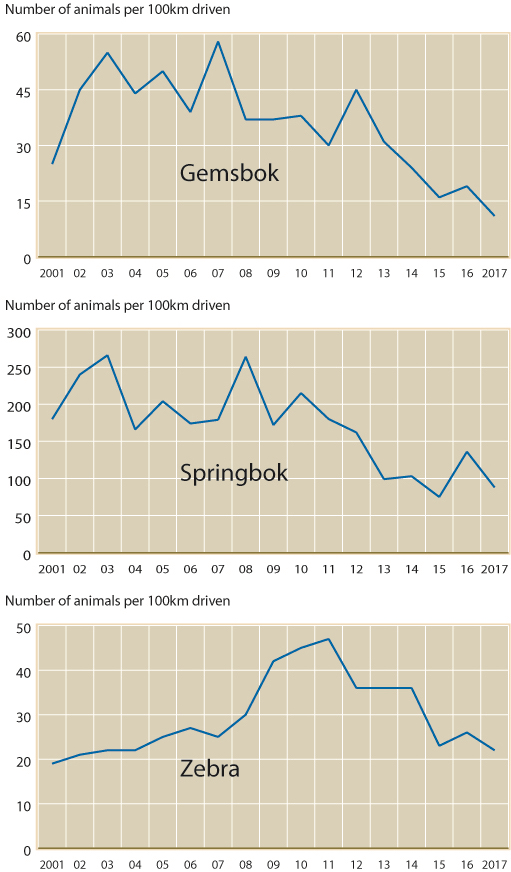
North-West population estimates
The graphs on the left show total estimated populations of 3 indicator species: gemsbok, springbok and zebra, from aerial censuses prior to the year 2000.
The annual North-West Game Count, shown on the right for the same species, counts the number of animals seen per 100 kilometres driven. This graph shows population trends over time and does not show total population estimates.
Natural resource management - at a glance
At the end of 2017 there were...
- 84 conservancies using the Event Book monitoring tool (figures include 3 unregistered, emerging conservancies & the Kyaramacan Association).
- 51 conservancies conducting an annual game count.
- 5 national parks undertaking collaborative monitoring with conservancies.
- 71 conservancies holding quota setting feedback meetings.
- 71 conservancies with own-use harvesting quotas.
- 56 conservancies with conservation hunting concessions.
- 19 conservancies with shoot & sell harvesting contracts.
- 46 conservancies with a wildlife management plan.
- 45 conservancies with a zonation plan.
- 616 game guards and resource monitors working in conservancies.
Biggest Challenges
- Keeping offtake quotas low, despite conservancy expectations of meat as a significant benefit of conservation hunting.
- The possibility of wildlife crime increasing as syndicates move from other African countries into Namibia.
- Land allocation and land invasions threatening areas reserved for wildlife.
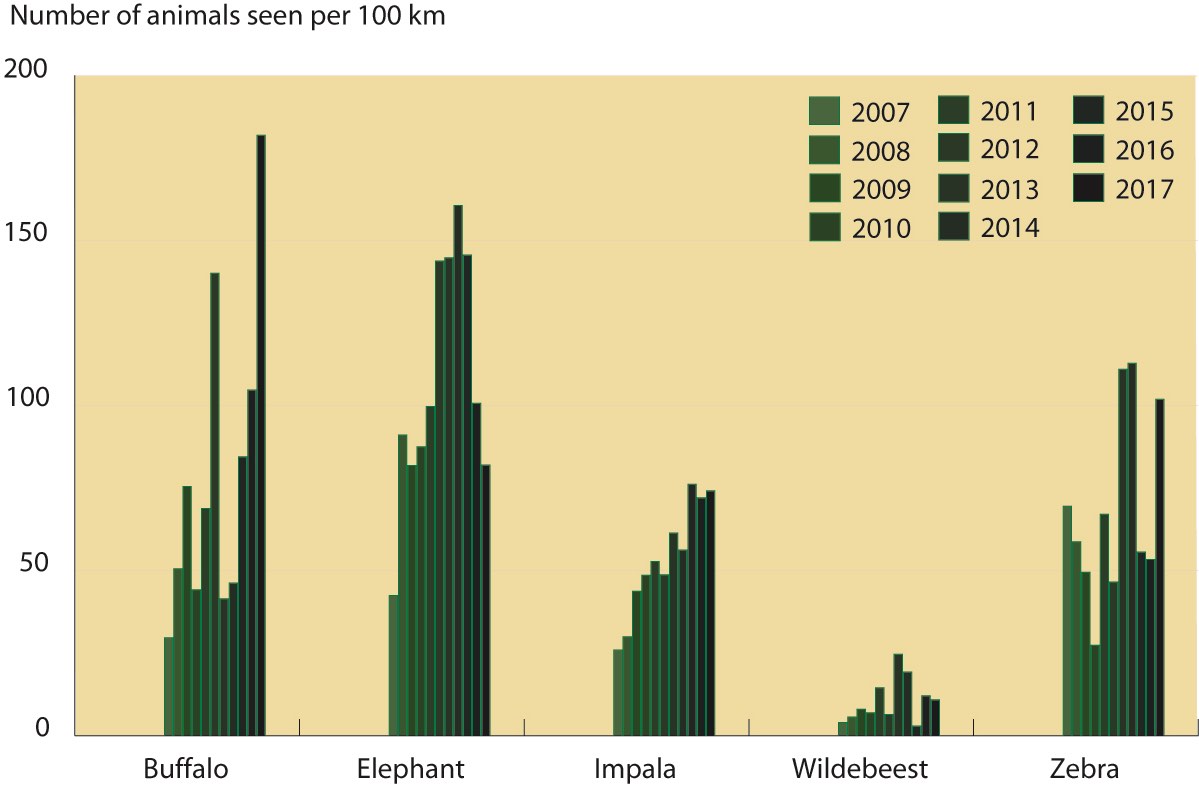
The North-East game count
Significant wildlife recoveries have also occurred in the Zambezi Region. These have been due largely to breeding, reduced poaching, wildlife introductions, and a removal of the hostile environment for wildlife. Although poaching had declined substantially over the last 15 years, there has been a sharp increase in ivory poaching, which is of great concern. Five selected species are shown in this graph, which includes national parks adjacent to conservancies. Wildlife moves freely between park and conservancies in the region. 2017 has seen a marked reduction in the species indicated in the figure.
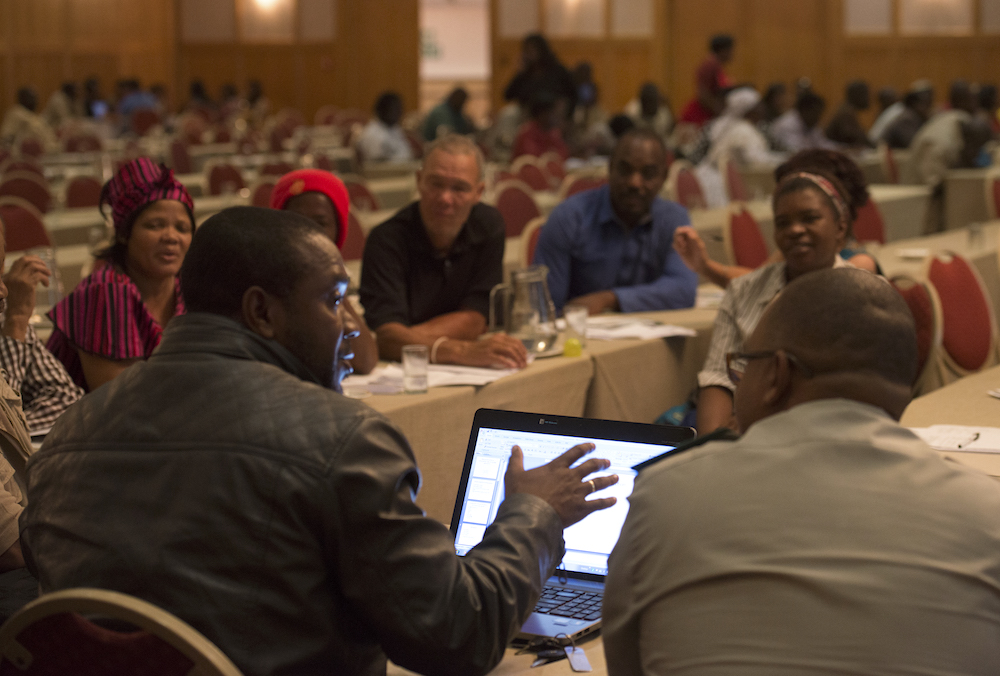
Community Conservation Governance
.. means creating structures that enable wise and effective governance which empower rural people to control their affairs and resources for a common, sustainable good...
Auditing is crucial
Conservancies are self-governing bodies, which elect boards and operate in accordance with their constitutions. They should be accountable to their members through annual general meetings. The MET has laid down Standard Operating Procedures, which set out the essential elements of good governance. The MET and NACSO conduct integrated annual audits in all conservancies to assess whether wildlife and financial monitoring is taking place.
With 83 conservancies to cover, these audits cannot carry out financial book-keeping, which requires professional expertise. Conservancy financial mismanagement has been a growing concern, which loomed large in 2017. It is important to note that mismanagement is different from theft or fraud. Although there were cases of misappropriation of cash, some of which are being investigated by the police, most financial mismanagement is the result of poor record keeping and a lack of supported receipts.
These issues were picked up in Zambezi conservancies, some of which have employed an external accountant to audit their books. As a result, the MET held a workshop on the issue with conservancies in the region. A similar exercise has yet to be undertaken in Kunene and other conservancies.
Organising meetings in rural areas, where transport is often a large problem, can be difficult. Nevertheless, the annual integrated audits show that most conservancy governance structures are working. The number of AGMs held in 2017 was 57: up from 52 the previous year. However, the number of management plans in place fell from 52 to 46. Clearly, conservancies need to follow the Ministry’s Standard Operating Procedures better.
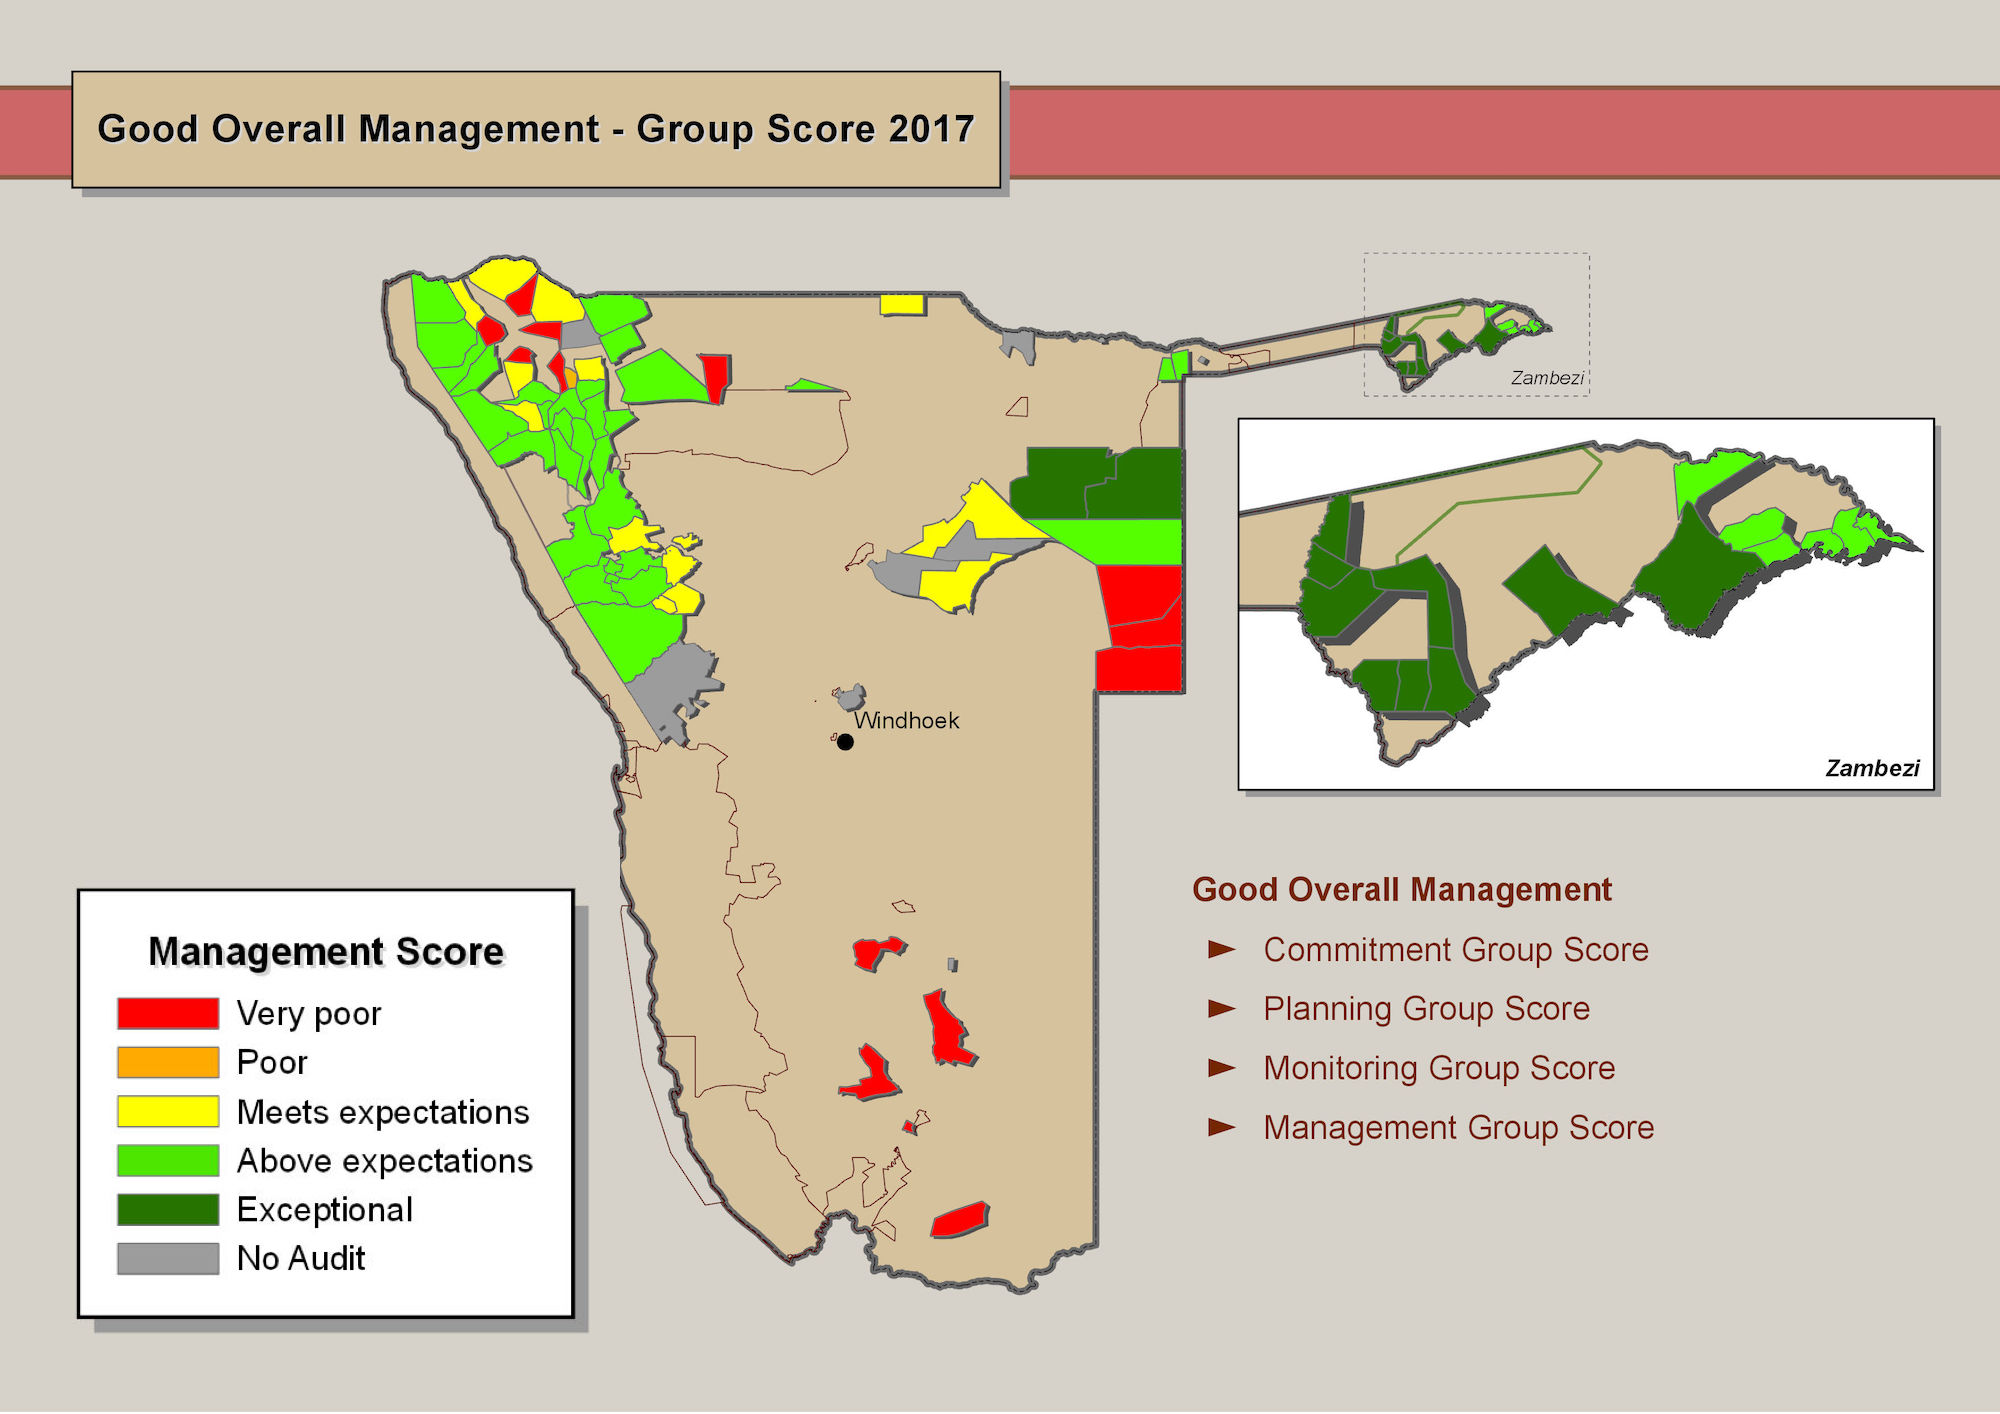
Natural resource management performance ratings
Institutional development data is collected annually during integrated performance audits. Conservancies are rated for their commitment, planning, monitoring and management. Conservancies use the information to evaluate and improve their governance, while support organisations are able to provide targeted assistance.
Community conservation governance - at a glance
At the end of 2017 there were...
- 46 management plans in place.
- 24 sustainable business and financial plans in place.
- 57 annual financial reports that had been presented.
- 55 annual general meetings that had been held.
- 15% female chairpersons.
- 44% female treasurers/financial managers.
- 34% female management committee members.
- 26% female staff members
Biggest Challenges
- Financial mismanagement.
- Conservancy elites failing to engage with members.
- Following MET Standard Operating Procedures.
Institutional development in conservancies in 2017
| Category | Status | Number of conservancies reporting |
Percentage of category |
|---|---|---|---|
| Registered conservancies (incl. Kyaramacan assoc.) | 84 | 84 | 100 |
| Conservancies generating returns | 69 | 84 | 82 |
| covering operational costs from own income | 39 | 54 | 56 |
| distributing cash or in-kind benefits to members, or investing in community projects | 44 | 54 | 81 |
| Conservancy management committee members | 846 | 71 | 100 |
| female management committee members | 285 | 71 | 34 |
| female chairpersons | 11 | 71 | 15 |
| female treasurers/financial managers | 31 | 71 | 44 |
| Conservancy staff members | 831 | 71 | 100 |
| female staff members | 215 | 71 | 26 |
| Conservancies management plans | 46 | 71 | 63 |
| sustainable business and financial plans | 24 | 71 | 34 |
| Conservancy AGMs held | 57 | 71 | 80 |
| financial reports presented at AGM | 52 | 71 | 73 |
| financial reports approved at AGM | 48 | 71 | 68 |
| budgets approved at AGM | 44 | 71 | 62 |
A comparison with previous years shows that conservancy management capacities fluctuate, influenced by staff and committee changes, as well as the degree of external support. Many conservancies have strong and growing female participation, and a substantial number of conservancies that used to be dependent on grant aid are now covering operational costs from their own income, with many also distributing benefits to members or investing in community projects. Figures include the Kyaramacan Association, which operates as a de facto conservancy within Bwabwata National Park.
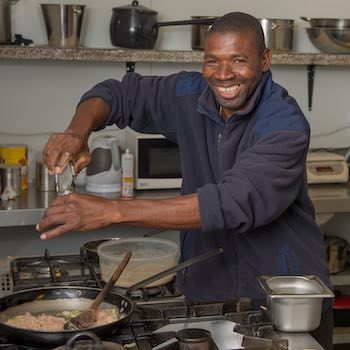
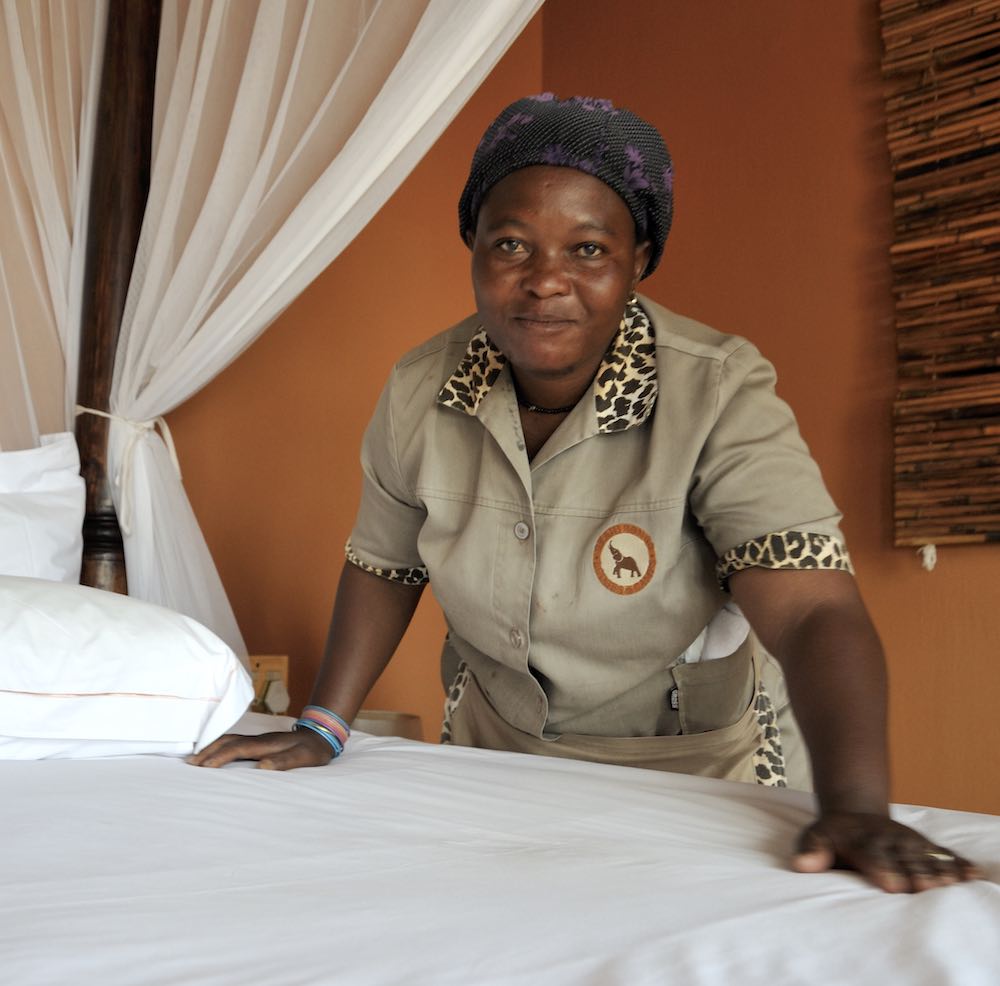
Improving Lives
... means empowering people to diversify incomes from farming to include new economic opportunities based on tourism and wildlife ...
Income sources...
Returns from wildlife and other natural resources generated through community conservation have proven to be substantial, including direct income to conservancies from tourism and conservation hunting, jobs created, and benefits including the distribution of game meat. New opportunities for rural job creation have arisen, especially in tourism where people are employed in a range of activities.
... and diversification
Diversification of income is a significant contribution to peoples’ livelihoods and contributes to community resilience against episodic events such as drought and floods. The ability to cope with such events is increasingly necessary for rural communities confronted with the harsh reality of climate change.
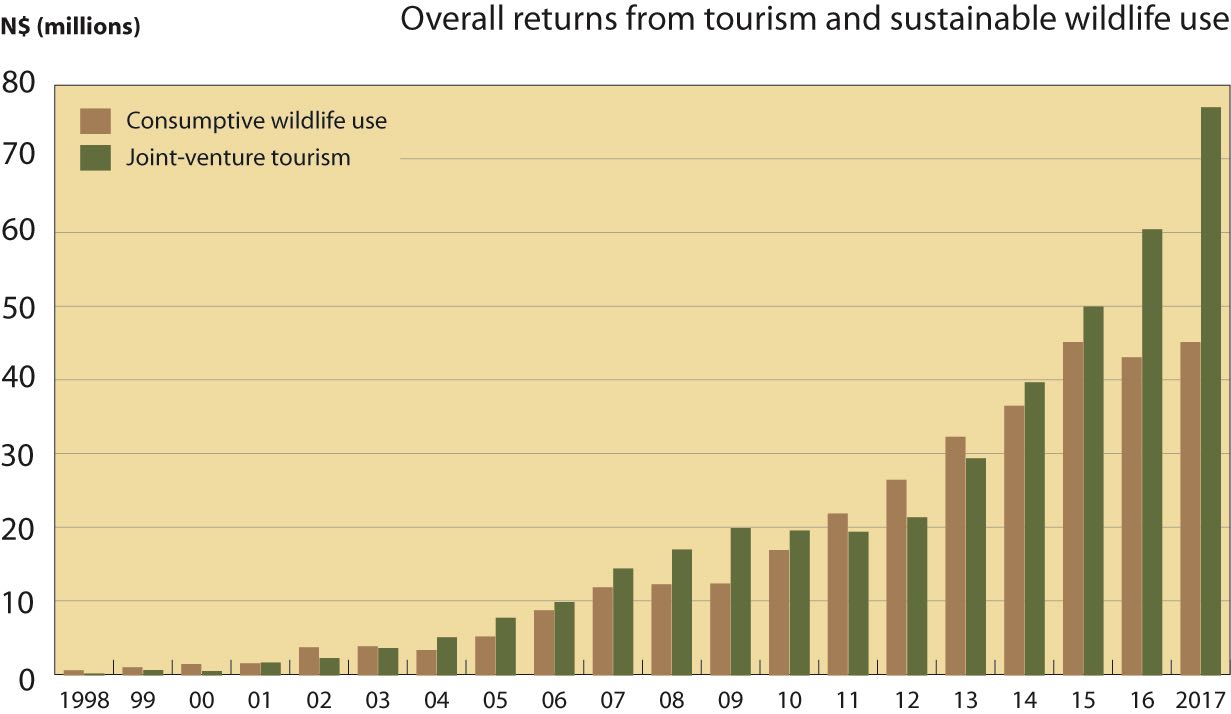
The earning power of conservancies
Significant differences exist between conservancies. There are vast differences in size (the biggest conservancies are more than 200 times as large as the smallest), as well as in the number of residents (ranging from several hundred to more than 30,000). Topography, rainfall and natural habitat influence the quantity and quality of natural resources available in a given area. The skills and experience of conservancy management also affect earning power. Joint-venture tourism and conservation hunting make the greatest financial contributions to conservation, e.g. game guard salaries, and to livelihoods. Meat from hunting is an important in-kind benefit to conservancy members.
Improving livelihoods - at a glance
At the end of 2017 there were...
- 38 conservancies directly involved with tourism activities.
- 54 joint-venture tourism agreements with enterprises employing 935 full time and 110 part time staff.
- 56 conservation hunting concessions with 152 full time and 167 part time employees.
- 17 small/medium enterprises with 78 full time and 42 part time employees.
- 831 conservancy employees.
- 846 conservancy representatives receiving allowances.
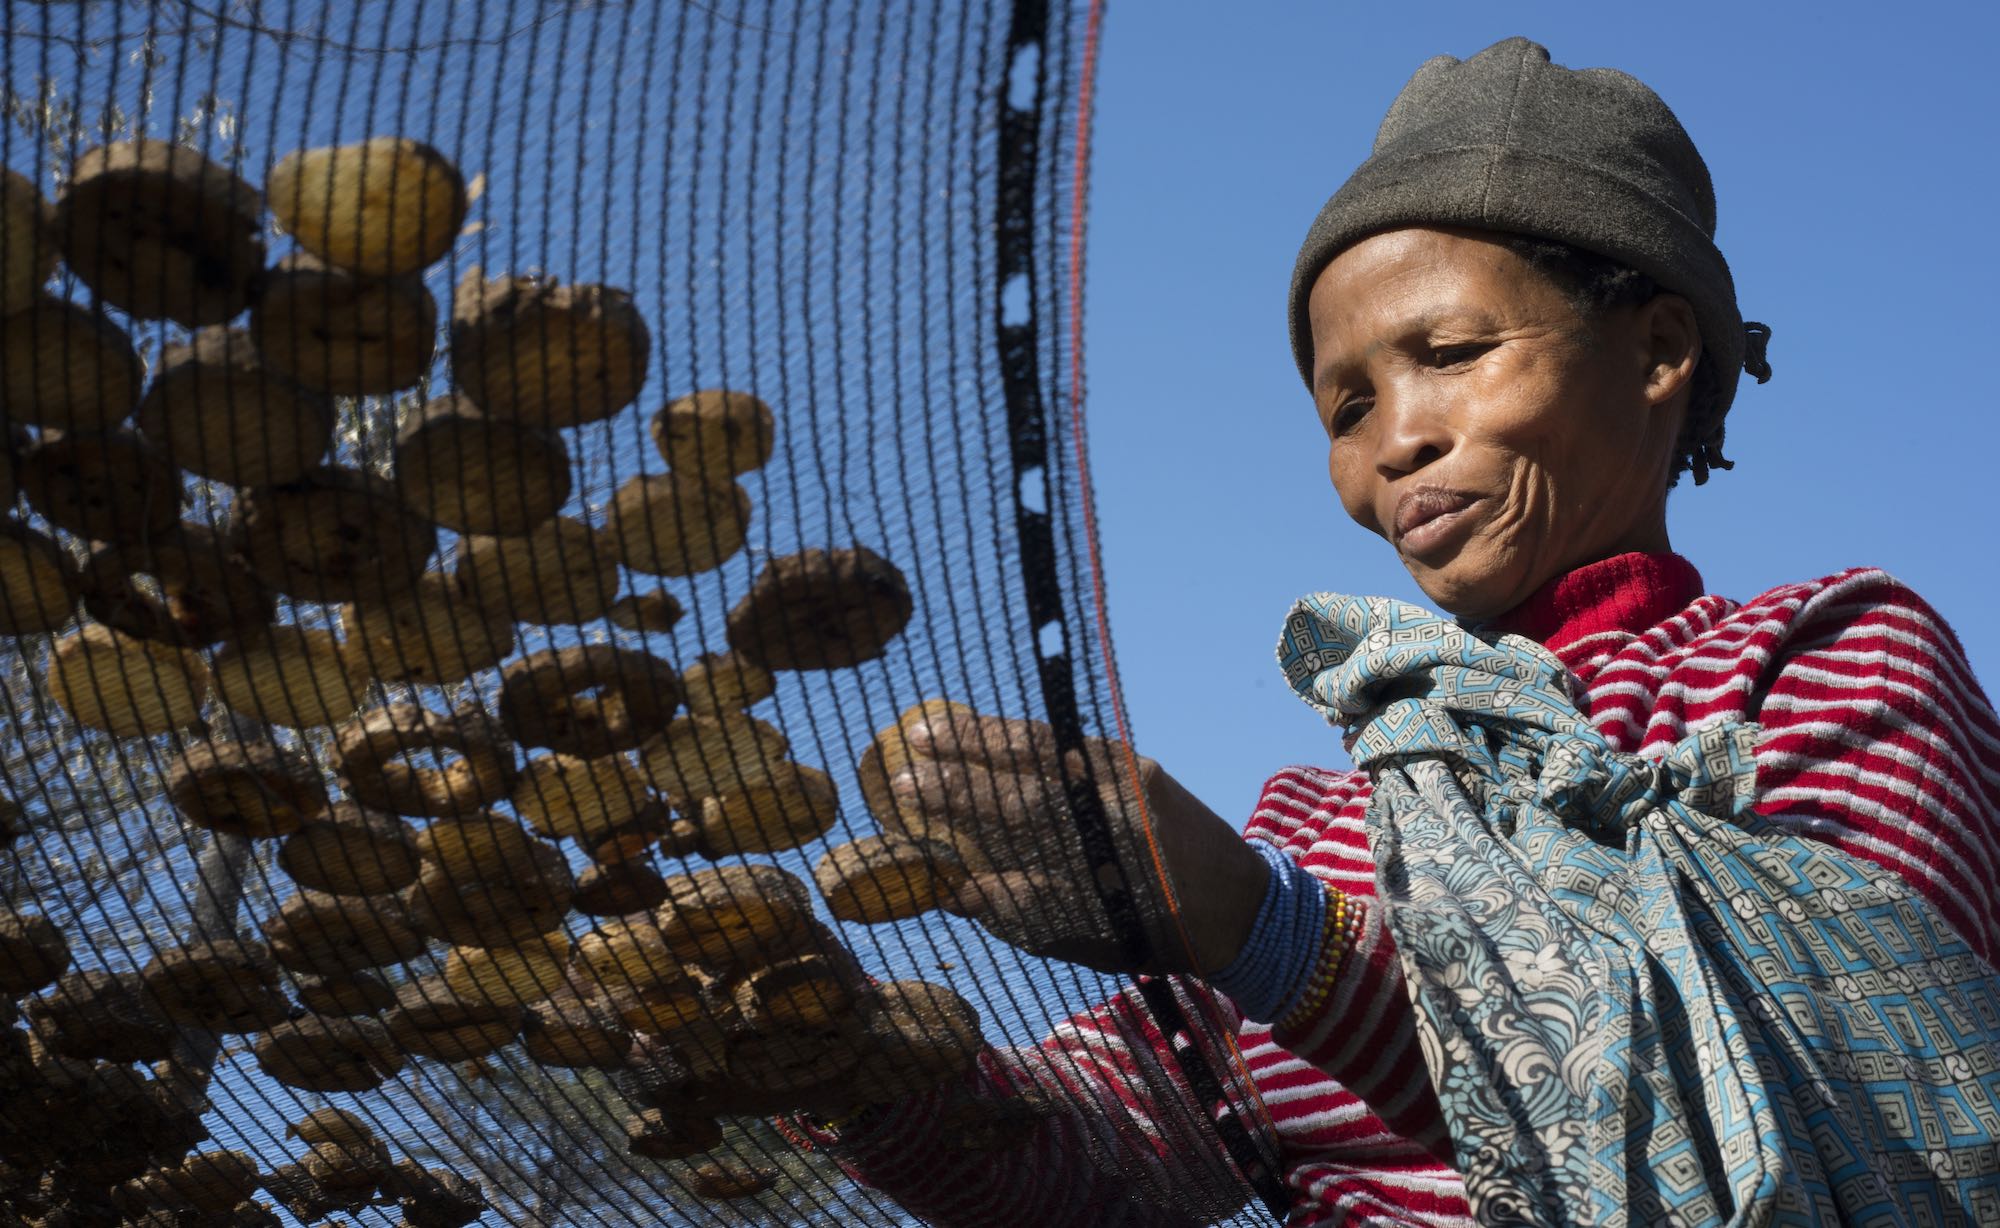
- 1,704 indigenous plant product harvesters.
- 445 craft producers
What’s being achieved?
- Conservancies and private sector partners generated N$ 132,824,233 in returns and benefits during 2017
- of this, tourism generated N$ 80,117,640; conservation hunting N$ 32,503,047 including meat distributed to conservancy residents valued at 12,566,280; indigenous natural products N$ 5,191,002; and miscellaneous income (including items such as interest) N$ 2,446,264
- Conservancy residents earned a total cash income of N$ 65,828,264, from enterprise wages, of which N$ 42,081,247 was from joint-venture tourism, N$ 18,861,815 from conservancies, N$ 3,558,788 from conservation hunting and N$ 1,326,414 from SMEs.
- Conservancy residents earned cash income of N$ 4,632,261 from indigenous plants and N$1,429,933 from crafts.
- N$ 16,159,501 was distributed to residents and used to support community projects by conservancies.
Income from the harvesting of indigenous plant products grew by three times from 2016 to 2017. The harvesting of organically certified devil’s claw and commiphora were responsible for most of this income in the north-east and north-west respectively. Although this income is very welcome, it could also diminish quickly if demands for these products were to fall in Europe. Indeed, for several years the perfume industry did not buy commiphora, leading to a loss of income to many harvesters.
National economic growth and CBNRM
Community conservation has an impact on the broader economy of the country significantly exceeding direct returns to rural communities, and contributes to nation building by contributing to national economic growth. This national impact can be assessed by taking into account all income streams flowing to communities, government and the private sector through related value chains as a consequence of community conservation.
Additional income is derived from:
- airlines, hotels and car rental companies;
- private sector tourism and hunting operations related to conservancies;
- sales of crafts, fuel and food;
- interest, taxes and rentals;
- further spending generated by the additional income above.
A Common Vision
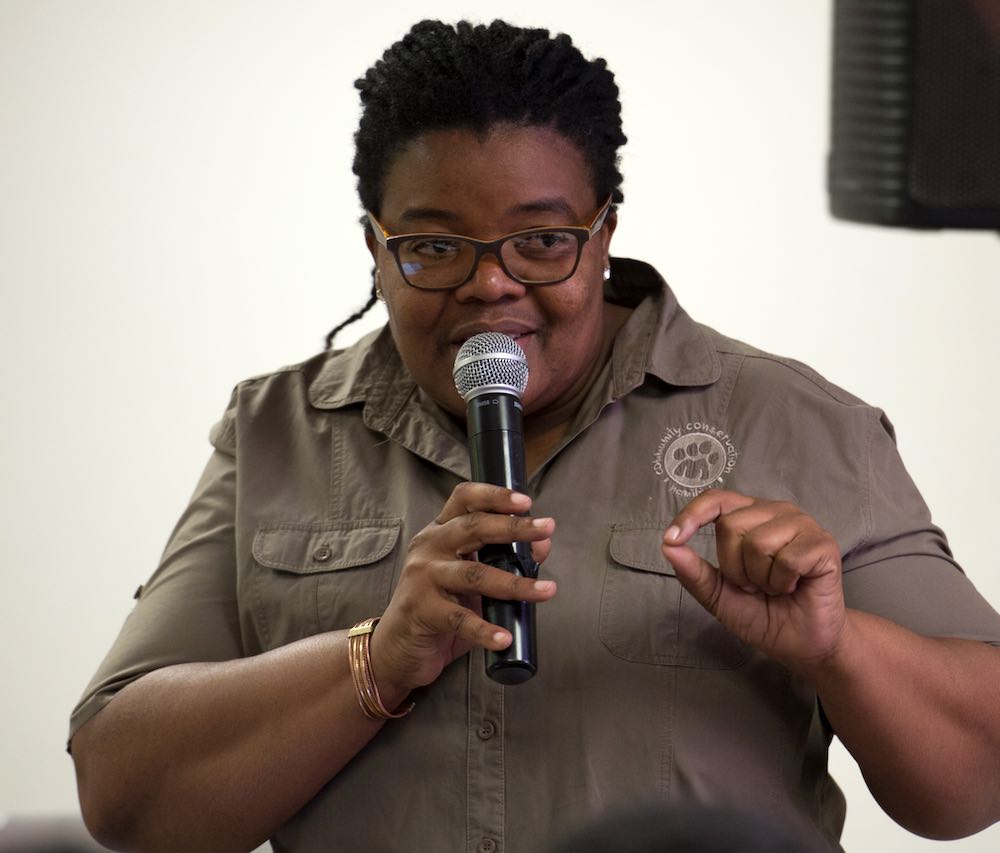
NACSO Director Maxi Louis says:
NACSO’s relationship with the MET is superb. We look at the key issues together, and decide whether an issue would be better addressed by the MET, or by NACSO or one of its members – and then take action. As a result we can arrive at common positions on issues such as human wildlife conflict – where the Ministry is developing new policy guidelines – on poaching and wildlife crime, on business opportunities in conservancies, as well as on international issues.
Regional conservancy associations and their development is very important for NACSO and, I believe, the MET. Their key role is advocacy. The associations can relay critical information to central government and to regional councils. Some of the associations are doing this very well in areas where NACSO support organizations lack capacity to cover large distances and to hold regular meetings. The Kunene associations have been very active in discussing human-wildlife conflict, and advocating for better practices by farmers to minimize losses.
All in all, I believe that we are doing well, but that we are overstreched. Our commitment to working hand-in-hand with the MET and, of course, with conservancies and their members, will help us through challenging times.
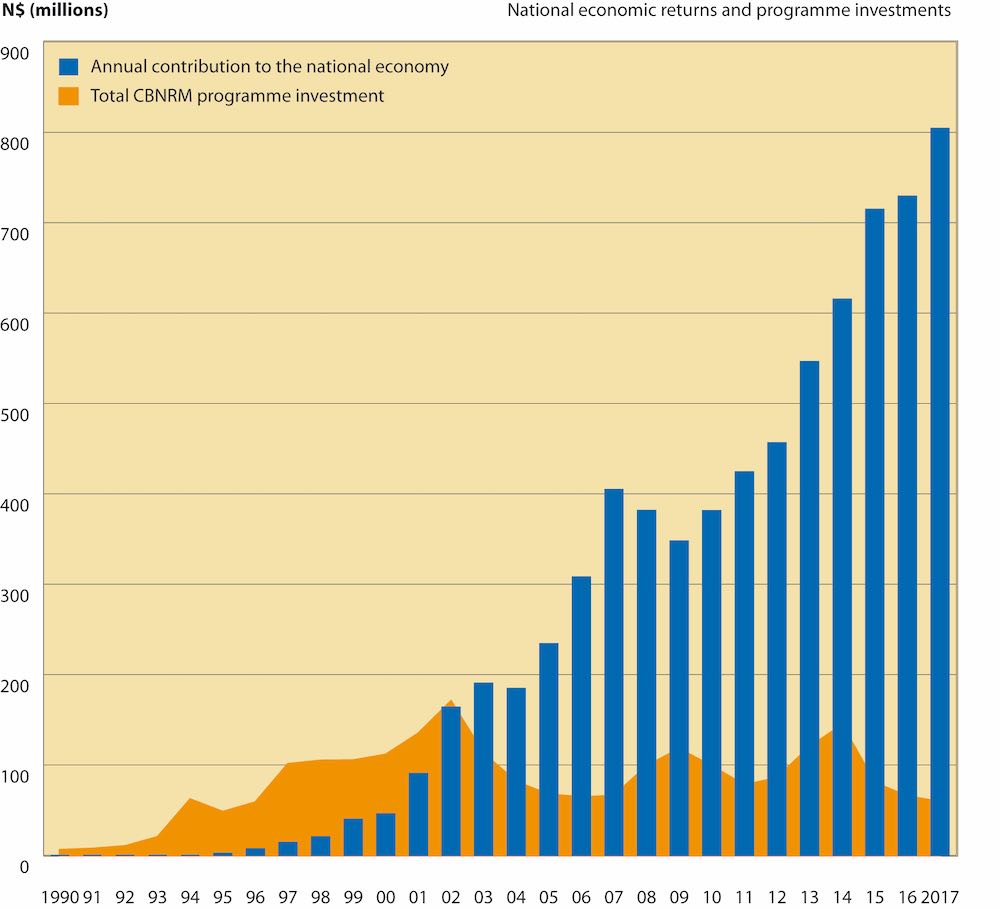
Estimates of the national economic returns from CBNRM compared to economic investment costs
In 2017, the net national income (NNI) contribution made by CBNRM was about N$ 804 million. Between 1990 and 2017, the cumulative value of the NNI contributions amounted to an estimated N$ 7.11 billion*.
The graph also shows the investment in the CBNRM programme each year, which cumulatively adds up to about N$ 2.3 billion between 1990 and 2017. Donors supplied most of the funds, while the MET and NGOs also provided inputs, mainly as ‘in-kind’ contributions such as staff, vehicles and other kinds of support.
*Figures have been adjusted for inflation to be equivalent to the value of Namibia dollars in 2017. This means they are not directly comparable with those used in the 2016 Community Conservation Report, which used figures equivalent to the value of Namibian dollars in 2016.